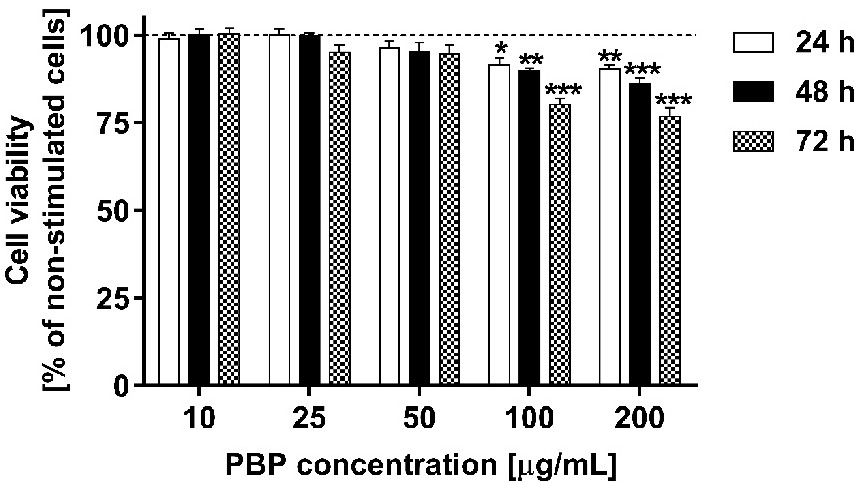
Fig. 1. Cell viability of murine breast cancer 4T1 cells stimulated with different concentrations of protein-bound polysaccharides (PBP) for 24, 48 and 72 h. Cell viability was assessed by the MTT colorimetric method. The data are shown as the means ± SEM of three independent experiments with six wells for each experiment. The results are expressed as a percentage of control non-stimulated cells (served as 100%; horizontal line). Asterisks show significant differences between the PBP-treated cells compared with non-stimulated cells (***P<0.001; **P<0.01, *P<0.05).